Photogrammetry of Fissure 8, Mount Kilauea, Hawai’i
“Estimating Volume Changes in Volcanic Features with UAV Photogrammetry”
Duration: Oct 2018 - Dec 2018
Affiliation: Yale School of the Environment
What: Course project
My Role: Sole analyst and author
The Task
After decades of dormancy, Mount Kilauea began actively erupting on May 3, 2018. Fissure #8, emerging within a populous subdivision, was the most active and most closely monitored fissure during this eruption.
For my “Photogrammetry with Drones” course project, I worked with then-unreleased UAV imagery of the fissure (thanks to Angie Diefenbach, USGS / VDAP) to try and reproduce findings by USGS analysts.
The Objectives:
- Create a 3D mesh and digital elevation model (DEM) of Fissure 8’s spatter cone and lava channel based on two UAV photo surveys, taken 7 days apart (late August & early September)
- Georeference one of the 3D models, which lacked GPS coordinates
- Calculate the difference in fissure volume between the two dates
- Compare the height of the UAV-derived fissure models to a LIDAR-derived surface surveyed earlier that summer
- Visualize cross-sections of the fissure structure and compare across dates
My Approach:
First, I generated a point cloud of the feature using AgiSoft Photoscan, which required extensive manual editing to remove erroneous points caused by steam. After creating a 3D mesh of the fissure, I then used the UAV imagery and DEM of the August model to georeference the September model within AgiSoft.
Photoscan’s volume calculation tool did not suit my purposes, since I did not have a reference plane against which to compare my spatter cone model. Instead, I exported my DEMs to ArcScene 10.7 to calculate the volume difference between the August and September models.
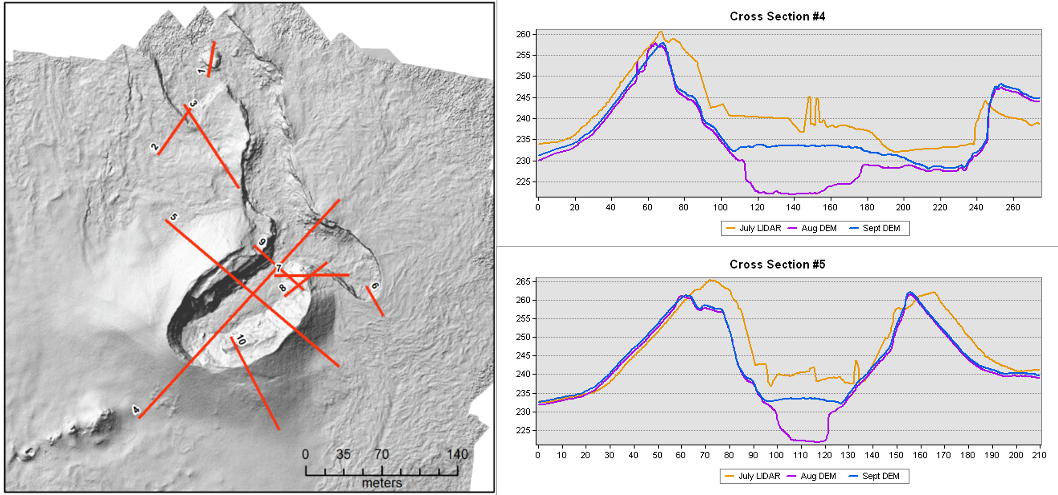
Finally, I plotted various cross-sections of the fissure using the Stack Profile 3D Analyst tool in ArcMap, to compare the area’s terrain in July, August, and September simultaneously.
Outcome highlights
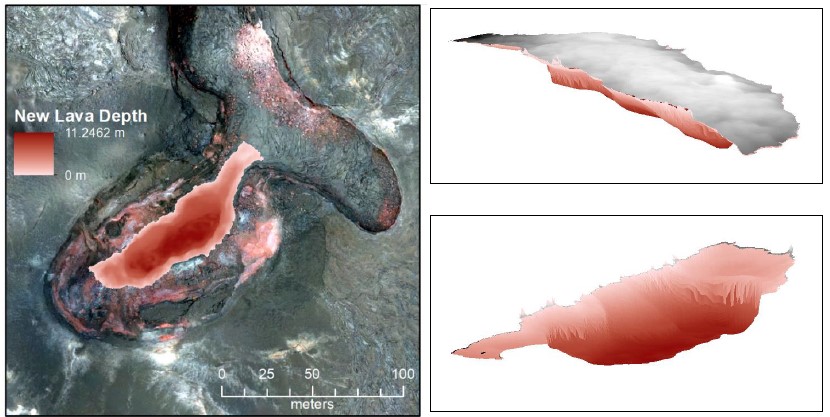
- A lava lake within the Fissure 8 cone appeared sometime between Aug 27 and Sept 2, containing an estimated 13,066 m3 of lava (+/- 28 m3). Assuming that lava infill began on Sept 1–as noted in field reports–the estimated rate of lava fill is 363 m3 per hour.
- The area of the fissure crater floor in the August 3D model matches USGS field observations almost exactly (65 x 15 m). Meaning: this photogrammetric model is a good representation of the real thing, and provides a functionally useful model for earth scientists.
- Large elevation discrepancies between the July LIDAR surface and the 3D models made the two impossible to compare quantitatively. However, the offset that I found matched the offset found by the Hawai’i Volcano Observatory (A. Diefenbach, personal communication).
- My cross-sections identified two zones of significant terrain change between the LIDAR and UAV DEMs; I attributed these changes to lava channel shallowing caused by slow-moving lava hardening into rock.
Data source:
Patrick, M.R., Dietterich, H., Lyons, J., Diefenbach, A., Parcheta, C., Anderson, K., Namiki, A., Sumita, I., Shiro, B., and Kauahikaua, J., 2019, Cyclic lava effusion during the 2018 eruption of Kīlauea Volcano: data release: U.S. Geological Survey data release, https://doi.org/10.5066/P9PJZ17R.